Creating the official Django Polls app Part 8
Social Share:
Saturday, January 11, 2025 at 12:14 AM | 5 min read
Last modified on Saturday, July 4, 2026 at 4:30 PM
#fullstack development, #macOS, #django, #python3, #django commons, #django debug toolbar, #django settings, #pip, #series, #third-party packages, #tutorial

Photo by David Clode on unsplash.com
Table of Contents
- Installing Django Debug Toolbar
- Customizing the toolbar
- Running my project in the browser
- Installing other third-party packages
- Code associated with this post
- Conclusion
- Related Resources
- Related Posts
Update (July 2026): This walkthrough was written against Django 5.1, which reached full end-of-life in December 2025 and is no longer receiving security patches. Run python -m django --version to check which version you have.
I became acquainted with third-party packages. One great thing about Django is its wide variety of third-party packages. They’re community-developed and are used to quickly add features to an application.
I learned how to add the Django Debug Toolbar, which is a commonly used third-party package. I hadn't used a debug toolbar like this before, so seeing SQL query counts and template render times on every page was new to me.
Installing Django Debug Toolbar
The Django Debug Toolbar is maintained by the community organization Django Commons. The toolbar helps me understand how my application functions and to identify problems. It does so by providing panels that provide debug information about the current request and response. What I really like about it is how it appears in the web page, which means I don't have to take the extra step of going into a browser console and debug there.
To install a third-party application like the toolbar, I needed to install the package by running the below command within an activated virtual environment. This is similar to my earlier step for installing Django:
pip install django-debug-toolbar
Then, as before, I ran the following command to add django-debug-toolbar to my requirements.txt:
pip freeze > requirements.txt
After running pip freeze > requirements.txt, I also had to add the package to my INSTALLED_APPS in settings.py:
INSTALLED_APPS = [
    # ... all other apps
    'debug_toolbar',
]
Then I had to add the Debug Toolbar middleware to my MIDDLEWARE setting in settings.py:
MIDDLEWARE = [
    # ... all other middleware
    'debug_toolbar.middleware.DebugToolbarMiddleware',
]
I had to configure an INTERNAL_IPS in settings.py to allow the toolbar to be displayed (typically set to '127.0.0.1'):
INTERNAL_IPS = [
    '127.0.0.1',
]
I also had to add the following to django_polls/urls.py:
# django_polls/urls.py
import debug_toolbar

urlpatterns = [
    path('polls/', include('polls.urls')),
    path('admin/', admin.site.urls),
    path('__debug__/', include(debug_toolbar.urls)),
]
The above configuration is not from the official Django Debug Toolbar documentation. Their way differs slightly. The only place where it differs is in urls.py.
# django_polls/urls.py
from debug_toolbar.toolbar import debug_toolbar_urls

urlpatterns = [
    # ... the rest of your URLconf goes here ...
] + debug_toolbar_urls()
Either way works. Django Debug Toolbar's approach follows the configuration convention for development environments. I do something similar when configuring static files for development, specifically media (images) files.
If you want to learn more about Django Debug Toolbars, visit their documentation entitled Django Debug Toolbar Installation.
Customizing the toolbar
I could further configure the toolbar by using the DEBUG_TOOLBAR_CONFIG setting. You can refer to the documentation for the available options.
Running my project in the browser
Next, I started my Django development server and accessed my website in a browser. If I accessed the site from an allowed IP address (as specified in INTERNAL_IPS), I should see the debug toolbar on the page.
When I visit http://127.0.0.1:8000/polls/, the browser window looks like the following:
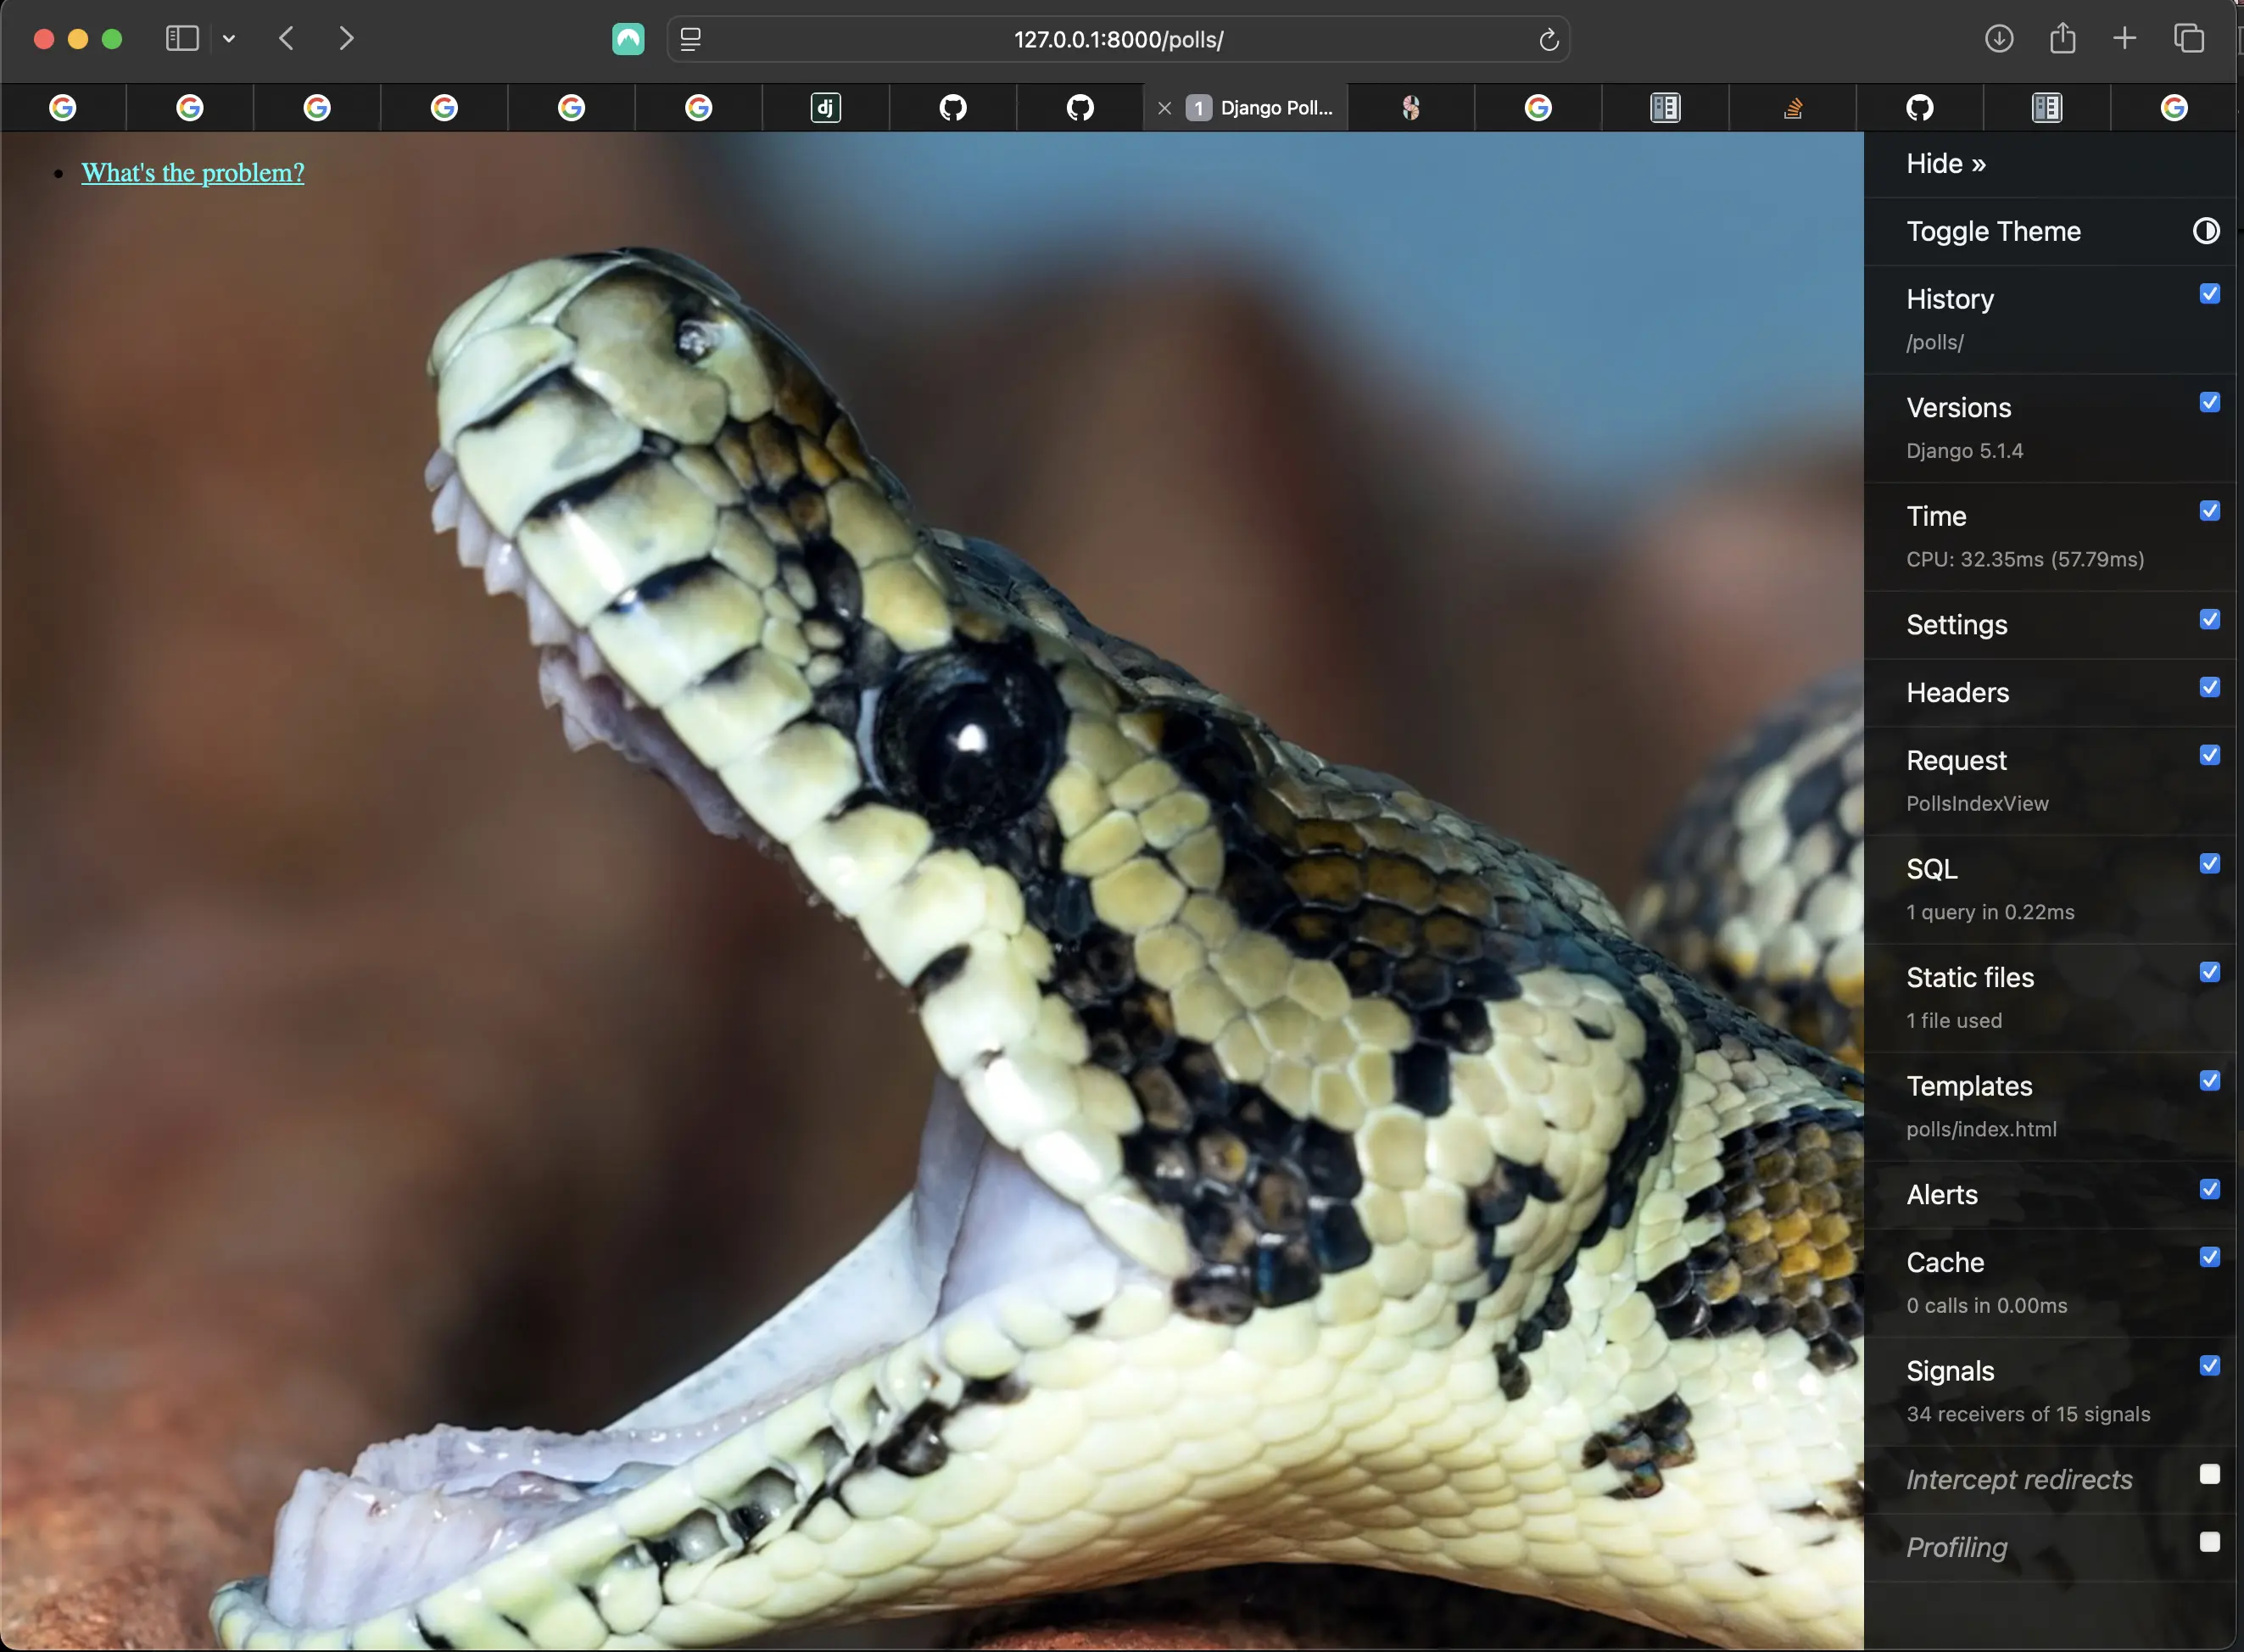
Adding the django debug toolbar
Wherever I went on the site, the Django debug toolbar would appear.
I also should be able to see the DjDT “handle” on the right side of the browser window when I browse to http://localhost:8000/admin/. I can click it to open the debug toolbar and use the tools in each panel. I can hide it by clicking "Hide" at the top of the toolbar panel. You can view the panels documentation page for more information on what the panels show.
When I went into my admin interface in the browser, it looked like the following:

Admin interface including Django Debug Toolbar
When I clicked on "Hide" to the top right of the browser window, the following appeared:

Appearance of the DJDT box
When I clicked on the DJDT box, the Django Debug Toolbar reappeared.
Note July 4, 2026: I hadn't logged into the Django Polls admin interface in a very long time, so when I tried today, I wasn't able to get in. I got the following in the web browser:

Login error due to un-synced or corrupt db.sqlite3 database
In order to rectify the matter, I reset the db.sqlite3 database:
# removes the existing db.sqlite3
rm db.sqlite3
# Creates a clean new migration which creates a fresh, clean db.sqlite3
python manage.py migrate
# Creates a new superuser because previous one was wiped in the reset
python manage.py createsuperuser
At first, I tried to recreate the superuser credentials that I had previously, but the password I tried to add was rejected. That could have been because something went wrong with how the password was recorded when I recreated the account, possibly during the confirmation prompt. I never fully pinned down the cause, but recreating it with a new username and password worked immediately. Then I revisited the other superuser and changed the password:
# Changes the password for the superuser with the username polls-admin
python manage.py changepassword polls-admin
When I changed the password, I was able to successfully login using polls-admin. Then I deleted the other superuser I had just created.
Installing other third-party packages
There are many more third-party packages which I can find using the Django resource Django Packages.
It can be hard to choose which third-party packages I should use. It really depends on my needs and objectives. Sometimes it’s okay to use a package that’s in alpha stage. Sometimes I need to know if it’s production ready. Adam Johnson (who's written a lot of great articles on Django development) has a blog post regarding what qualifies a package as “well maintained” entitled The Well-Maintained Test: 12 Questions for New Dependencies. Django Packages shows data for some characteristics, such as when a package was last updated.
According to Writing your first Django app, part 8,
As Adam points out in his post, when the answer to one of the questions is “no”, that’s an opportunity to contribute.
If you want to see what Django suggests for next steps, please visit Writing your first Django app, part 8 and go down to the section entitled "What's next?".
The next (advanced) tutorial suggested by Django after this one is entitled How to write reusable apps. I know I will be checking it out to see if there is anything I haven't yet learned. I also have a series here on the site entitled "How to create a fullstack application using Django and Python" in which I write reusable apps. If you want to learn more, please visit How to create a fullstack application using Django and Python Table of Contents. Check it out!
Code associated with this post
To view the code associated with this post, please visit d231e4e.
Conclusion
In this section, I installed the Django Debug Toolbar, configured the toolbar so it would appear in the browser when I ran my development server, learned that I can customize the toolbar, ran my Django Polls project in the browser to view the toolbar, introduced resources where I could access other third-party packages to use in my applications, and I provided next steps.
Related Resources
- Writing your first Django app, part 8: Django documentation
- Django Debug Toolbar Installation: Django Debug Toolbar documentation
- Django Debug Toolbar on GitHub: Django Debug Toolbar on GitHub
Related Posts
- Creating the official Django Polls app table of contents: mariadcampbell.com
- How to create a fullstack application using Django and Python Table of Contents: mariadcampbell.com